About this semi-log graph paper
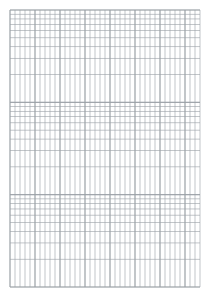
Semi-log graph paper has a logarithmic vertical axis and an ordinary linear horizontal axis. Each band (called a cycle) covers one power of ten, so values from 1 to 1,000 fit on a single sheet.
When you plot something that grows or shrinks exponentially – bacteria, radioactive decay, compound interest – the points line up in a straight line, which makes the rate easy to read.
What it’s good for
- Exponential growth and decay
- Biology and chemistry lab data
- Frequency and decibel charts
- Compound interest
How to print it
Pick a size above and open the PDF. In the print dialog choose the same paper size and set the scale to 100% (Actual size), so the grid comes out at exactly log y-axis, 5 mm linear x-axis.
Questions
What is a log cycle?
One cycle spans a factor of ten, for example 1 to 10 or 10 to 100.
How many cycles are on a page?
A4 and Letter portrait pages have 3 cycles; smaller sizes have fewer.